Floodplain Mapping: From Data Collection to Comprehensive Maps

The process of floodplain mapping involves several steps and the integration of various data sources. Here is a general overview of the process and the types of data used.
Data Collection
The first step in floodplain mapping is to gather relevant data. This includes both spatial data and non-spatial data. Spatial data may include topographic information (elevation, slope, and aspect), hydrological data (river networks, stream flow measurements) and land cover data (vegetation, impervious surfaces). Non-spatial data can include historical flood records, rainfall data, and hydraulic modeling parameters.
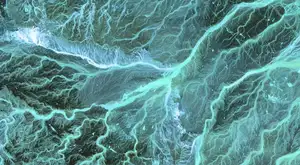
Topographic Data
Accurate topographic data is crucial for floodplain mapping. Digital Elevation Models (DEMs) are commonly used, which provide elevation values for each pixel or grid cell within the study area. DEMs can be obtained from sources such as LiDAR (Light Detection and Ranging) surveys, satellite imagery, or existing topographic maps.
Hydrological Modeling
Hydrological models simulate the behavior of water within a river basin or watershed. These models utilize inputs such as precipitation data, soil properties, land cover, and river channel characteristics to predict how water will flow and accumulate during a flood event. The output from hydrological models provides information on water levels, flow velocities, and flood extents.
Hydraulic Modeling
Hydraulic models focus on the behavior of water within river channels and floodplain areas. These models use the outputs from hydrological models as inputs and consider factors like channel geometry, roughness coefficients, and bridge and culvert capacity during a flood event. The output from hydrological models provides information on water levels, flow velocities, and flood extents.
Floodplain Zoning
Once the hydraulic modeling is completed, the floodplain can be divided into different zones based on the severity and frequency of flooding. These zones typically include the 100-year floodplain (the area with a 1% chance of flooding in any given year), the 500-year floodplain (the area with a 0.2% chance of flooding in any given year), and sometimes additional zones for lesser flood events.
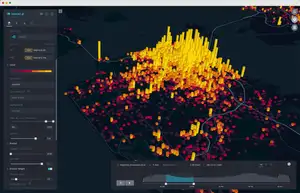
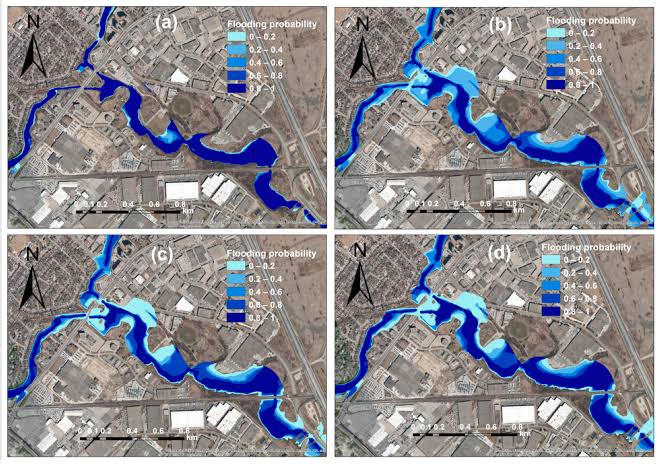
Map Creation and Visualization
The final step is to create floodplain maps using Geographic Information System (GIS) software. This involves overlaying the various data layers, such as topographic data, hydrological modeling results, and floodplain zoning, to generate comprehensive maps. These maps visually represent the floodplain areas, flood depths, flow velocities, and other relevant information.