Geospatial Data Analytics: The Key to Effective Public Administration

No matter how much the world changes and advances, the main responsibility of every government authority is effective public administration, and with all the advancements in technology, there are more effective ways to make things better for citizens.
One such tool is Geospatial analytics which can help us see patterns in many things. Even the most basic clustering can many times show you the information you need to make things better and that is what I’m going to talk about today. Let’s start with the first use case:
Traffic Accidents
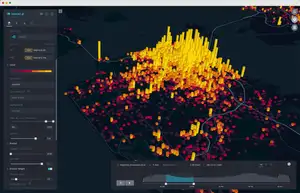
It all started with a recent experience that I had. I was working on a portal to show traffic accident data and it was during that work that I started to see patterns in traffic accidents.
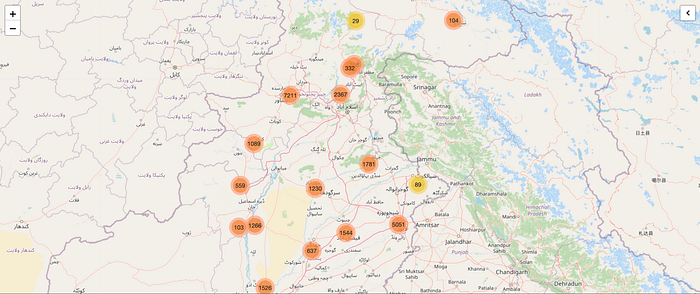
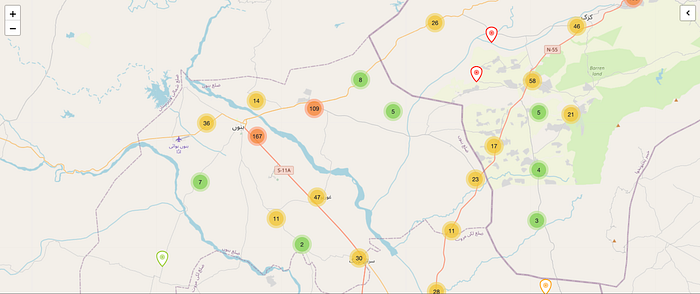
When I looked at the data, I could spot many hotspots of accidents for example this one had 31 accidents including 5 fatal accidents.
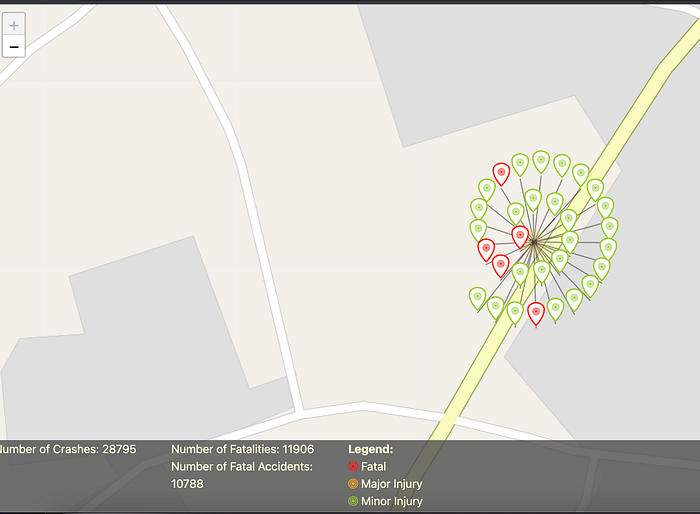
Or this one, which had 51 accidents including 4 fatal accidents.
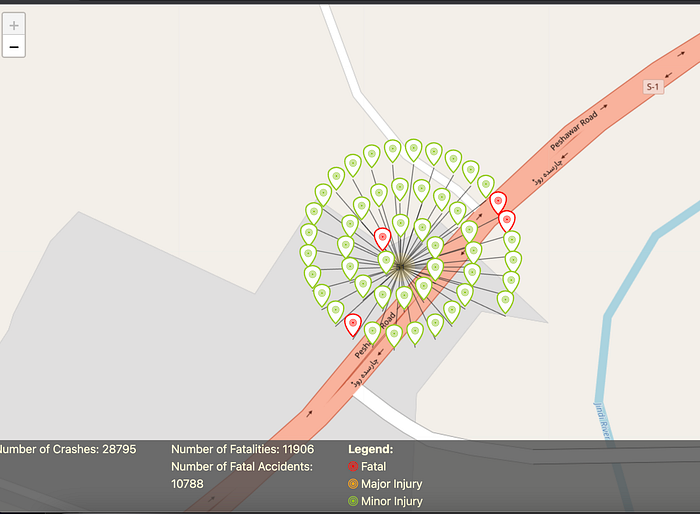
Or this one, which had 23 accidents but mostly fatal or with major injuries.

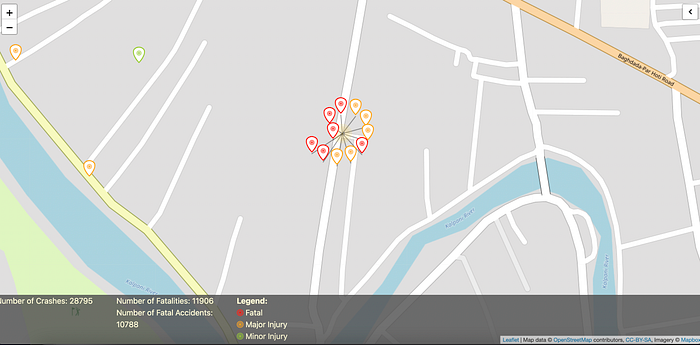
Or this one, which has 11 accidents at the same location but most of them are fatal and the rest resulted in major injuries.
I could go on and on and these clusters won't end but the point is that these patterns show vital information that can be used by the authorities to intervene and make the changes required to make those areas safer. All these clusters are potential spots for intervention.
Another dimension, i.e. time of day could be added to these and that would give an even clearer picture as to when and where the accidents are happening and the authorities could take the specific steps that are needed as it would reveal more information when the time dimension is added.
This is vital information that could save countless lives and make commuting a lot safer for citizens. In my opinion, all traffic regulating authorities should have a live portal like this where they can see all the details of all the accidents so that they can interfere whenever such clusters start to form.
Crimes
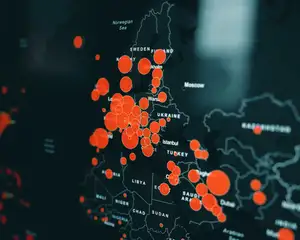
Similar mapping of crimes and time of day could reveal a lot of information about petty crimes in any urban metropolis. The following is a map of traffic accidents but a map of crimes could also look exactly the same.
In that data, there could be categorization that tells the type of crime for example theft, robbery, drug overdose, etc. And this categorization along with location and time could provide police and law enforcement authorities with vital information about the current scenario.
A live map like this of all the crimes that are reported could really help city police in finding patterns and intervening around clusters to make cities safer for the residents.
Public Health
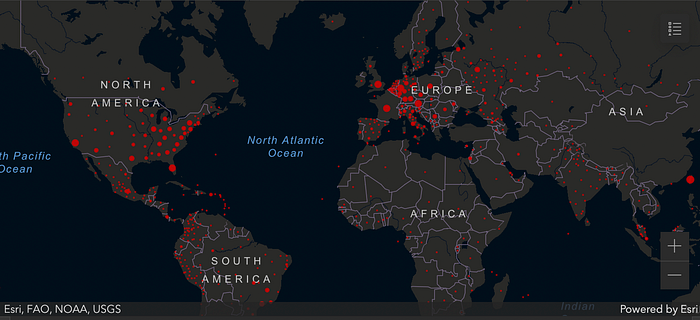
Another example of this sort of analysis could be in public health and we saw a demo of this during the COVID pandemic. The most famous of all these maps was the onecreated by the Johns Hopkins University These maps showed the spread and intensity of covid infections in different areas of the world.
I also created a Coronavirus map and talked about it in the story The Corona Map: Visualizing the Pandemic but that map is not live anymore so let’s not talk much about it, but if you are interested in knowing more about it then you can read the above story.
A similar map at a smaller (city) level could help authorities in making decisions about targeted lockdowns and other interventions to help slow down the spread of the disease. And this isn’t just relevant for covid but also for any other epidemic.
And other than just clustering, there could be more ways (such as contact tracing, etc.) to use geospatial data to help fight epidemics and pandemics. I talked about it in detail in a previous story “How Geospatial data can help fight Pandemics.
To summarize, the potential of geospatial data analytics in public administration is vast, offering unprecedented opportunities for improving public safety, health, and overall quality of life. These things weren’t possible before these tools were available. By using these tools, public administrators can make informed, data-driven decisions that have a meaningful impact on the communities they serve.
Article originally posted here.