Analysis of fires detected in the Paraná River delta, Argentina, using VIIRS product data. Part 1.

The purpose of this double-post is to provide a comprehensive, step-by-step guide that outlines one approach (among many possibilities) for analyzing and extracting valuable insights from a dataset of hotspots detected by VIIRS sensor in a selected study area. This guide will cover from loading and extracting the desired data from a dataset requested from NASA-FIRMS web page, to the processing and visualization of this data in order to gain valuable insights into the fire phenomena within the chosen study area and period of time.
This analysis will be focused on the Paraná River delta region in Argentina covering the period from 2012 to 2021. As elucidated later on, the data selected was the VIIRS Active Fire detection product data because the association between the hotspots detected by the sensor and vegetation fires. In the first part we will conduct a preliminary processing and extract the relevant data from a dataset encompassing fire occurrences throughout Argentina. The resulting dataset will subsequently serve to study the temporal and spatial distribution of the fires in our study area during the period selected.
Study area introduction
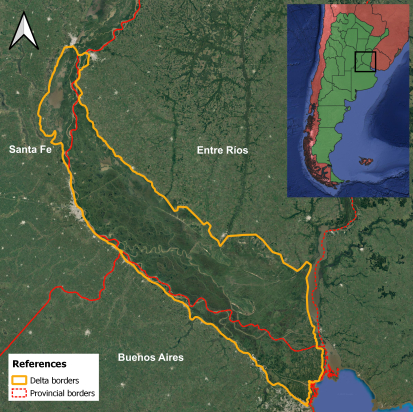
The Paraná River delta is one of the most important wetland spaces in Argentina and covers an area of 17.500 km2. It is located in the territories of the provinces of Santa Fe, Entre Ríos and Buenos Aires. In addition to its important ecosystem functions (such as housing a great variety of biodiversity, being a carbon sink, among other), it is also a territory where island residents live, as well as having economic value for its resources and the livestock farming that takes places there.
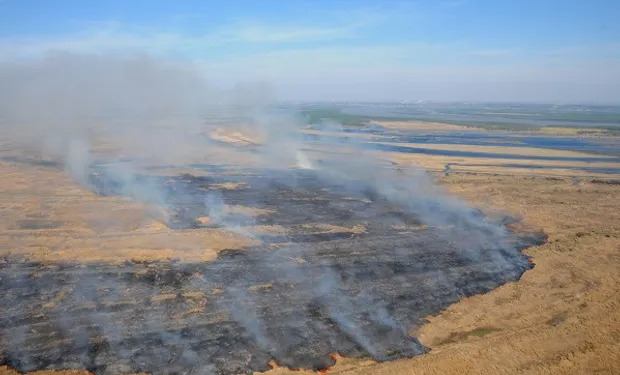
The burning of vegetation is a common practice in the Paraná Delta and its purpose is to remove those with little or no forage value for livestock. This practice is mainly carried out at the end of the winter with the aim of facilitating the regrowth of tender grasses for the cattle. In recent years, the large fires in the Paraná Delta have gained notoriety due the intensity and the number of areas affected, not to mention the serious consequences on the health of nearby populations such as Rosario city residents in Santa Fe province.
It should be noted that the delta area is strongly affected by the hydrological regime of the Parana and, to a lesser extent, Uruguay rivers. This area is also affected by meteorological events. Therefore, in a context where the effects of climate change are increasingly evident, which is reflected in historical lows of the mentioned rivers, heat waves and decreased precipitation, the availability of dry biomass that can be fuel for fires increases considerably. This, in turn, results in the previously mentioned situation, intense and difficult to control fires, which end up affecting large areas.
Considering all of the above, analyzing the phenomenon of fires in this area is of utmost importance in order to understand its temporal occurrence and spatial distribution, among other characteristics, with the goal of developing tools for the proper environmental management of this region in the current context.
Methodology
The processing of fires detected data from VIIRS product, which boasts a spatial resolution of 375 m, will be performed using Python and basic data analysis libraries such as Numpy, Pandas, Matplotlib, among others. More specific libraries will be used, such as Geopandas, which is highly useful for the analysis of georeferenced data. In addition to these VIIRS data, vector layer files will be implemented for the study area delimitation and relevant data filtering.
All the data and vector layers files were obtained from public access repositories. Finally, the implementation of the analysis was designed to be carried out in the Google Colaboratory environment with the aim of making it easier to perform for anyone interested.
Step-by-step guide preliminary processing and extraction of data
Libraries and functions
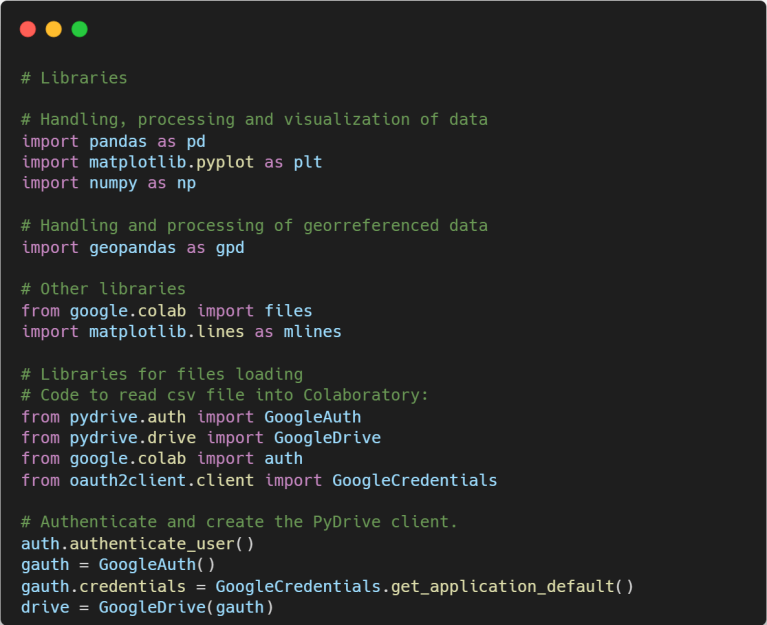
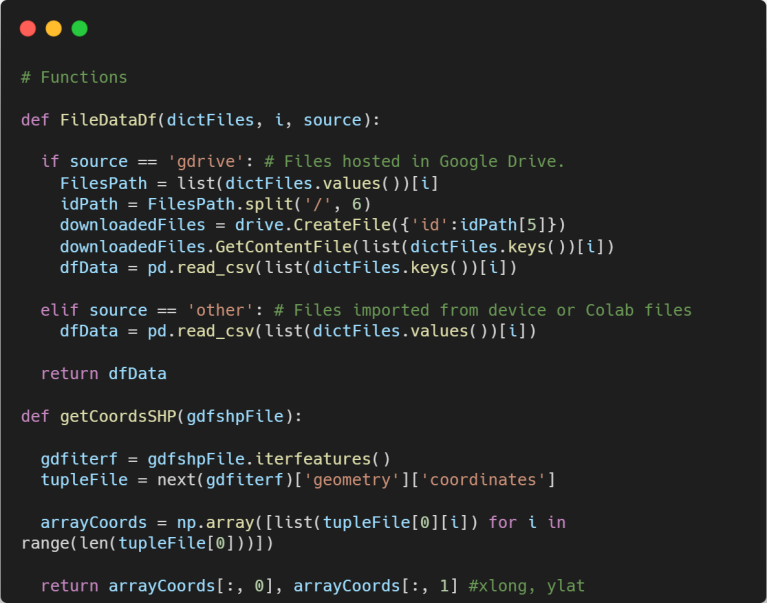
The first important thing we have to do is to import the necessary libraries, such as libraries for data processing and visualization, and Google libraries to load files stored in Google Drive, in case host your files there. Also we need to load that functions that will be used.
Data Loading
The format in which we can obtain data about fires from VIIRS products may vary. We can access and download this data from the FIRMS site database for different years individually, or we can make a request through the page and the data for the requested period can be returned to us. In the first case, we will have several files that we will have to merge later. In contrast, in the second case, we will receive an unified file. Regardless of the situation, loading of data will be executed as described below.
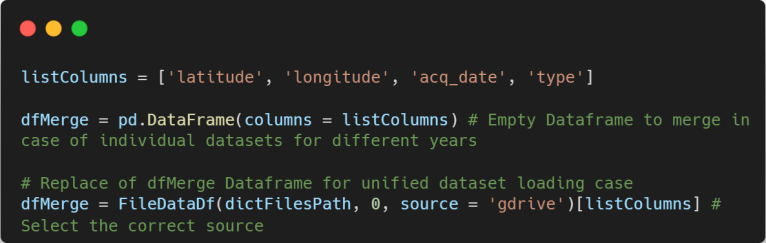
For loading the files containing the data, we will create a dictionary with a generic name for each csv file as dictionary key, and the file link or path as the corresponding key value, depending on where the file is hosted.
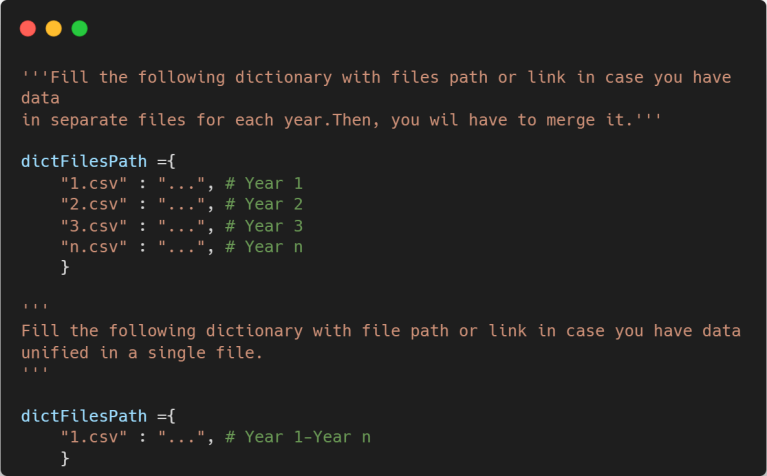
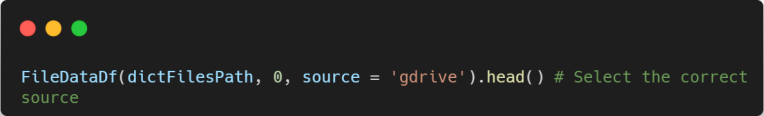
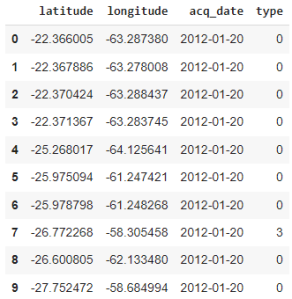
In our case, we will be working with a dataset that contains all the hotspots detected by VIIRS sensor for Argentina in the period 2011-2022, so we will use the code for the second case (unified data in a single file). Before creating our dataframe with data for further processing, let’s check if the data loads as we expect and datatypes are correct.
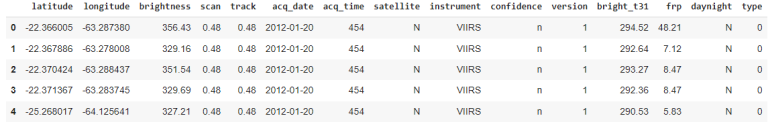
If you get the output as shown in the image above, it indicates that the data has been loaded correctly. According to the instructions provided in NASA Earth Data webpage2, our dataset should include all of these columns. For a detailed description of each attribute, you can refer to the NASA web portal.
Once data was loaded correctly, we can proceed to create the dataframe using the code provided below for both cases. For the purposes of this project, we will be using the columns selected in “listColumns”. You may want to work with other columns, so feel free to experiment.
Before continuing with processing of data, let’s get basic info from our loaded dataset.
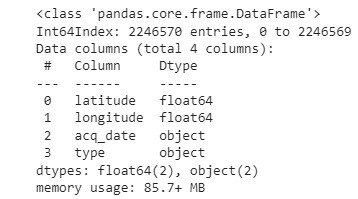

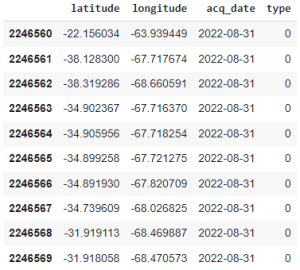
From this quick analysis, we can notice that our dataframe contains 2246570 entries, which is a significant amount of data. Another interesting thing we can observe, is that the first entries were recorded in 2012, while the last ones were recorded in 2022. Now, let’s proceed with the processing of this data in order to extract the data relevant to our study area and period of analysis.
Data Processing
Considering that the data contained in the dataframe corresponds to hotspots detected in Argentina, the first thing we will do is create a copy of the original one and give it a more appropriate name.

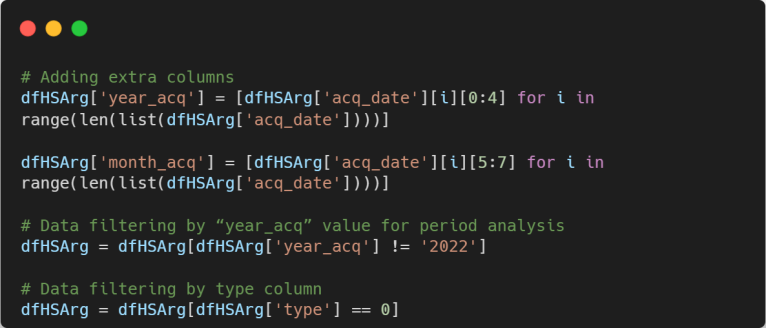
Having created the copy we can proceed with processing the dataset. First, we will add two additional columns, “year_acq” and “month_acq”, corresponding to the year and month of the date when the heat spot was detected. Then, given that our analysis period is from 2011 to 2021, we will filter the dataset based on the “year_acq” value, excluding the records equal to 2022.
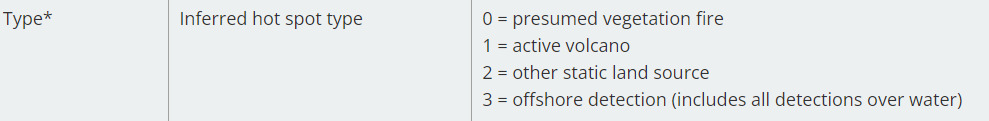
Finally, we will filter data based on the “type” column, selecting only records with a value of 0. The entries with this type value are the ones associated with presumed vegetation fire according to the description provided on the NASA-Earth Data website. As commented before, the data chosen to conduct this analysis was VIIRS Active Fire detection product data because direct link to fires. Hence, this step holds significant importance in ensuring the accuracy of our analysis.
Data Visualization and Extraction of Study Area Points
One of the particularities of georeferenced data is that we can plot it over a map and visualize its distribution in the space. In our case, we have a dataset that contains fires detected across the entire territory of Argentina, but our study area is just Paraná River delta. The next step is to select all the points that are within our study area. To achieve this, we will visualize the hotspots in our dataframe, its distribution in Argentina and our study area.
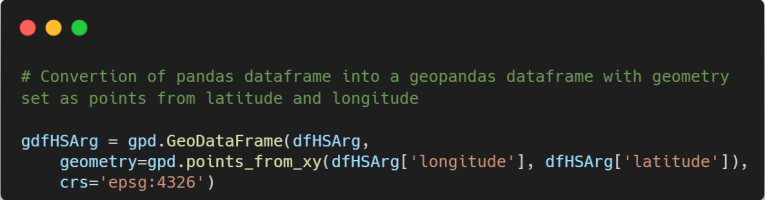
The first thing we have to do is to create a geodataframe from our original fataframe using Geopandas library. Note that we set as CRS (Coordinate Reference System) EPSG:4326. This system represents latitude on the Y-axis and ranges from -90 to 90 degrees, with the equator at 0 degrees latitude. Longitude is represented on the X-axis and ranges from -180 to 180 degrees, with the prime meridian (Greenwich meridian) at 0 degrees longitude.
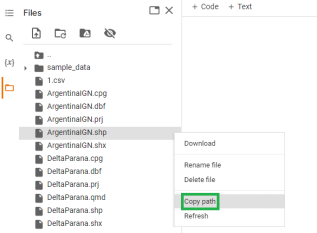
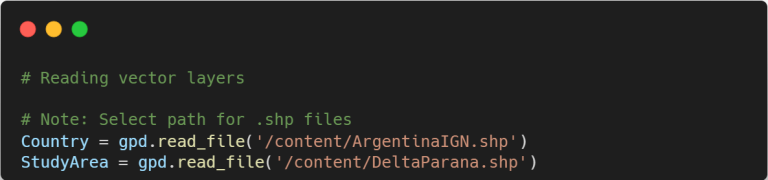
Once we have our data as a geodataframe, we need to load vector layers for Argentina and our study area. To accomplish this, we will load vector layers files as shapefiles in Colab and get its path as it is showed in figure below, then we will convert it into geodataframe too. Note that by default the CRS of both is EPSG:4326.
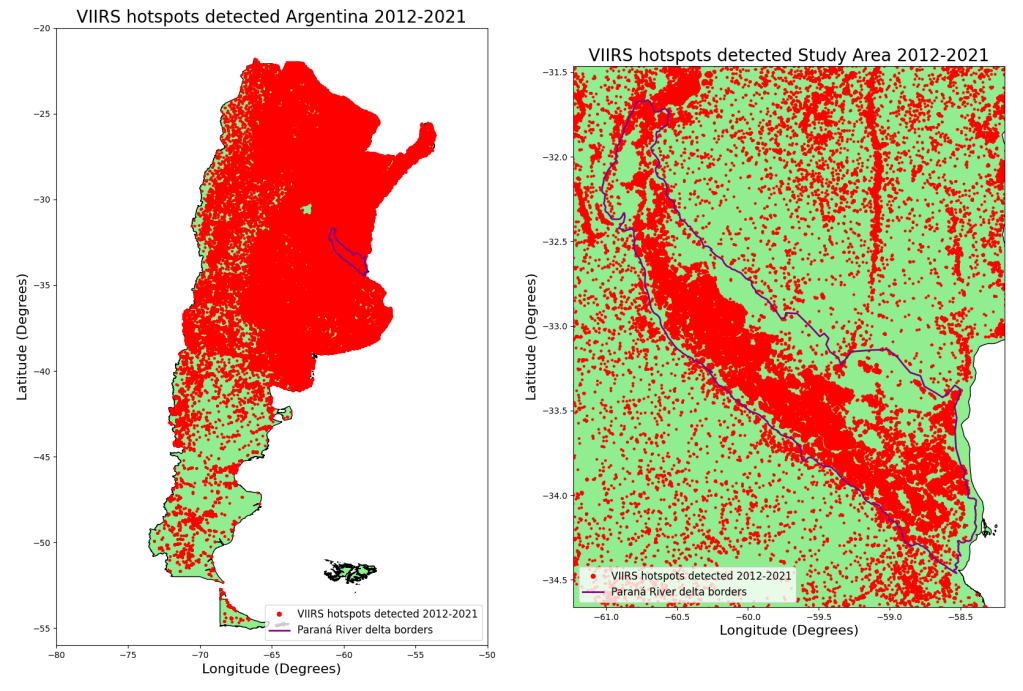
After loading our data and vector layers as geodataframes, we are ready to visualize all of it. By running the code below, we can obtain graphics shown in the following plot. On the left-hand side, we can observe all the fires detected by VIIRS sensor in Argentina for our study period, while on the right-hand side, we have a zoom in view of the study area, where the hotspots detected during the mentioned period can be better visualized.
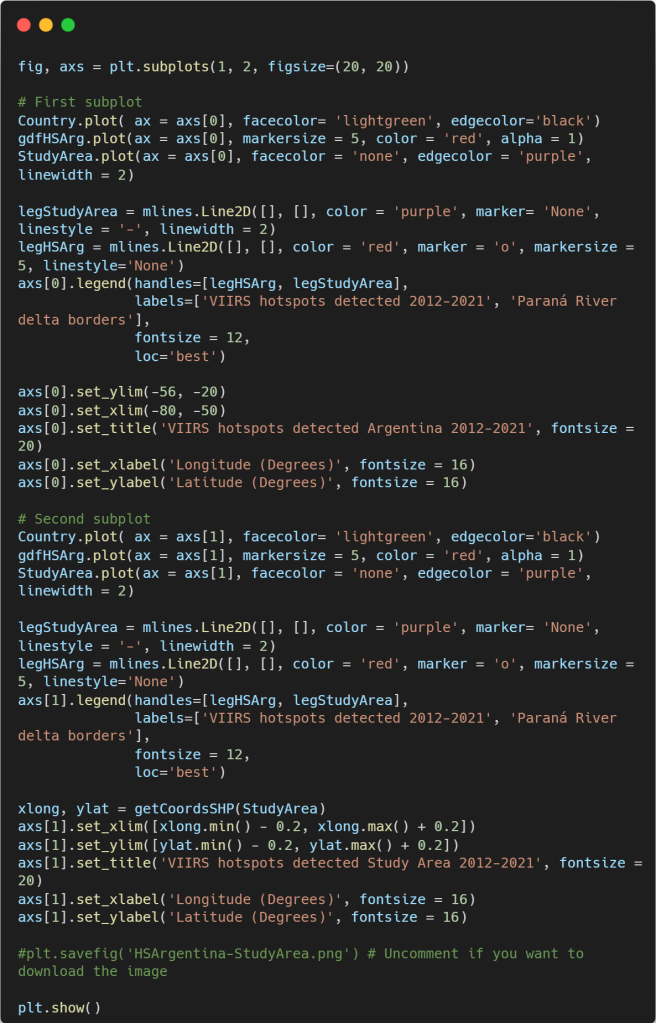

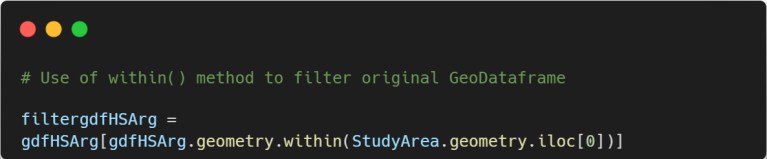
Based on the visualization of the data displayed above, we can state two things. Firstly, the images show how severe was the situation in Argentina for the study period regarding fires that occurred. Secondly, the data was loaded and processed correctly. Now, the last step is to select the hotspots data from our previous geodataframe that corresponds only to the Paraná River delta area. To do so, we will filter the data according to the vector layer of our study area.
Let’s analyze the geodataframe obtained after and filtering according to our study area.
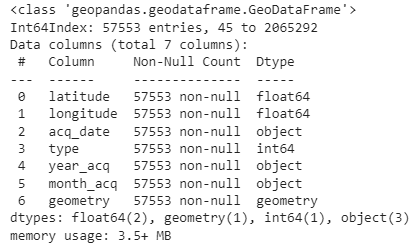
From the output shown before, we can observe that we have gone from a dataset with a total of 2246570 entries to one with 57553. That’s a very interesting reduction of total amount of data. Now let’s visualize this data on a map to effectively confirm that the new dataframe contains only the desired data.
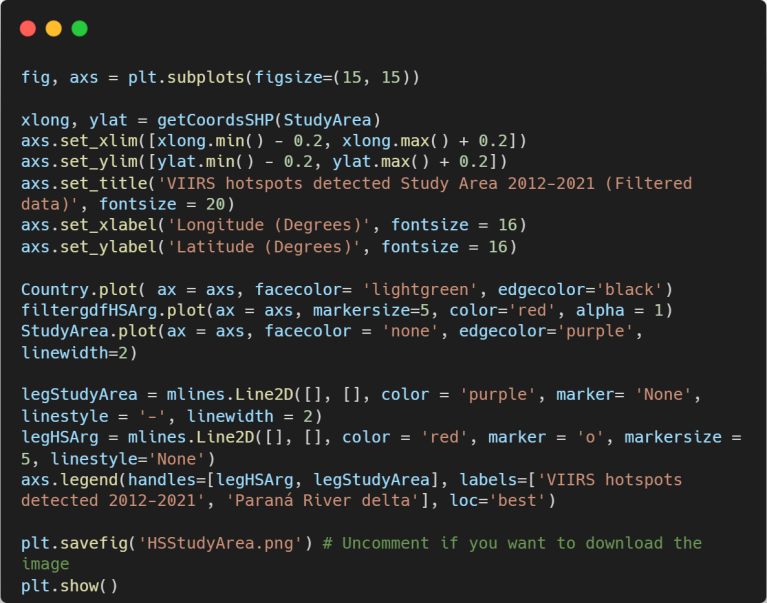
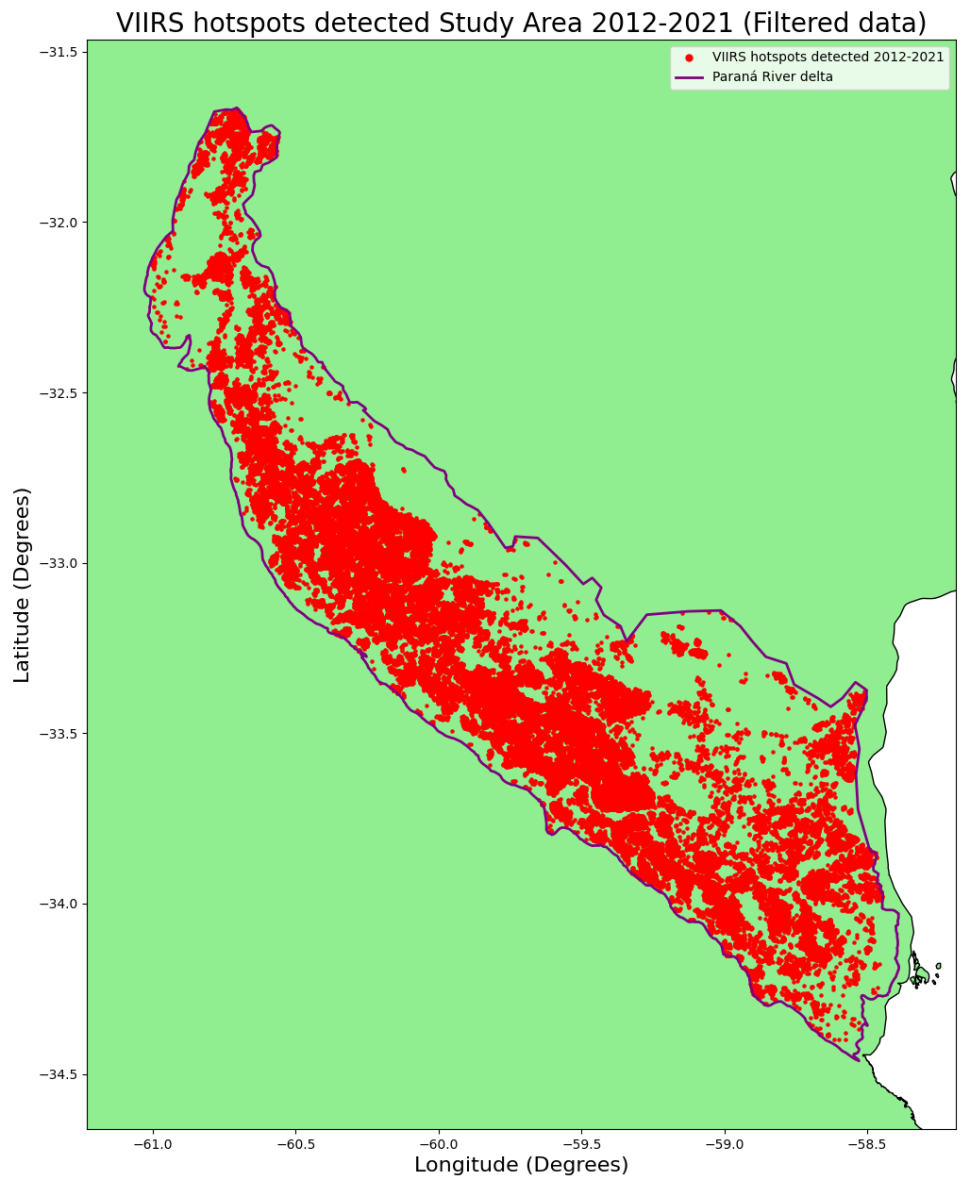
As we can see in the previous image, our final geodataframe only contains the data within Paraná River delta boundaries. Finally, we can save this data in a .csv file format.
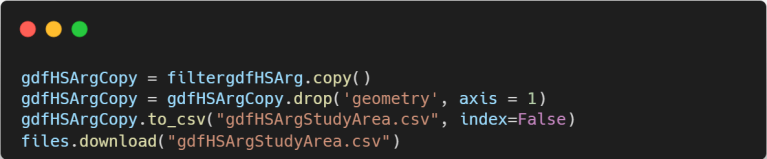
By exporting the processed data, we open up various possibilities for further exploration. One option is to import the data into GIS software, such as QGIS or ArcGIS, enabling us to create visualizations by integrating satellite images or other relevant sources. Alternatively, we can proceed delving deeper and continuing with the processing of the data aiming to uncover valuable insights regarding the occurrence of fires in our study area. This will be the focus of the second part of this guide.
Sources
Salvia, M. M. (2010). Aporte de la teledetección al estudio del funcionamiento del macrosistema Delta del Paraná: análisis de series de tiempo y eventos extremos.
Instituto Nacional del Agua, INA. (2018). Delta del Paraná: Proyectos Estratégicos para el Desarrollo Sustentable. Informe 01: “Base de datos Georeferenciada del Delta de Paraná”.
References
2 https://www.earthdata.nasa.gov/learn/find-data/near-real-time/firms/vnp14imgtdlnrt
Links to repositories
VIIRS Active Fire product data: https://firms.modaps.eosdis.nasa.gov/download/
Paraná River delta borders vector file: https://www.google.com/maps/d/u/0/viewer?mid=1_ArYZsWx-IvFCsNuXA-Z0u60vVcVLP76&ll=-35.24217356383713%2C-59.32243393359376&z=6
*Note: In this site you can get the layer as a KML file. After download, convert into a .shp file.
Argentina borders vector file: https://www.ign.gob.ar/NuestrasActividades/InformacionGeoespacial/CapasSIG
*Note: Select the layer named “pais” with geometry “poligono” (polygon).
Github repository of this project: https://github.com/francobarrionuevoenv21/codeforenviroprojects/tree/VIIRS_fires_Delta