R-Tree Geospatial Data Structure: Functionality, Benefits, and Limitations

Introduction
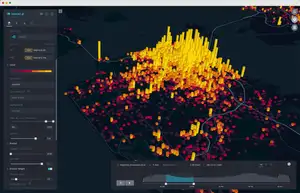
The R-Tree data structure plays a vital role in managing multi-dimensional geospatial data. In applications that require spatial indexing, such as logistics or urban planning, R-Trees offer dynamic, efficient, and balanced solutions. However, to effectively utilize these structures, a comprehensive understanding of their functionality, benefits, and limitations is crucial. This article provides an in-depth exploration of R-Trees, demystifying their role and operation in handling geospatial data.
What is R-Tree?
An R-Tree (Rectangle Tree) is a tree data structure used for indexing multi-dimensional information, such as geographical coordinates, rectangles, or polygons. The "R" in R-Tree stands for Rectangle — the foundational unit of this data structure. It was proposed by Antonin Guttman in 1984 as an extension to other tree data structures like B-Trees, to handle spatial data efficiently.

How Does R-Tree Work?
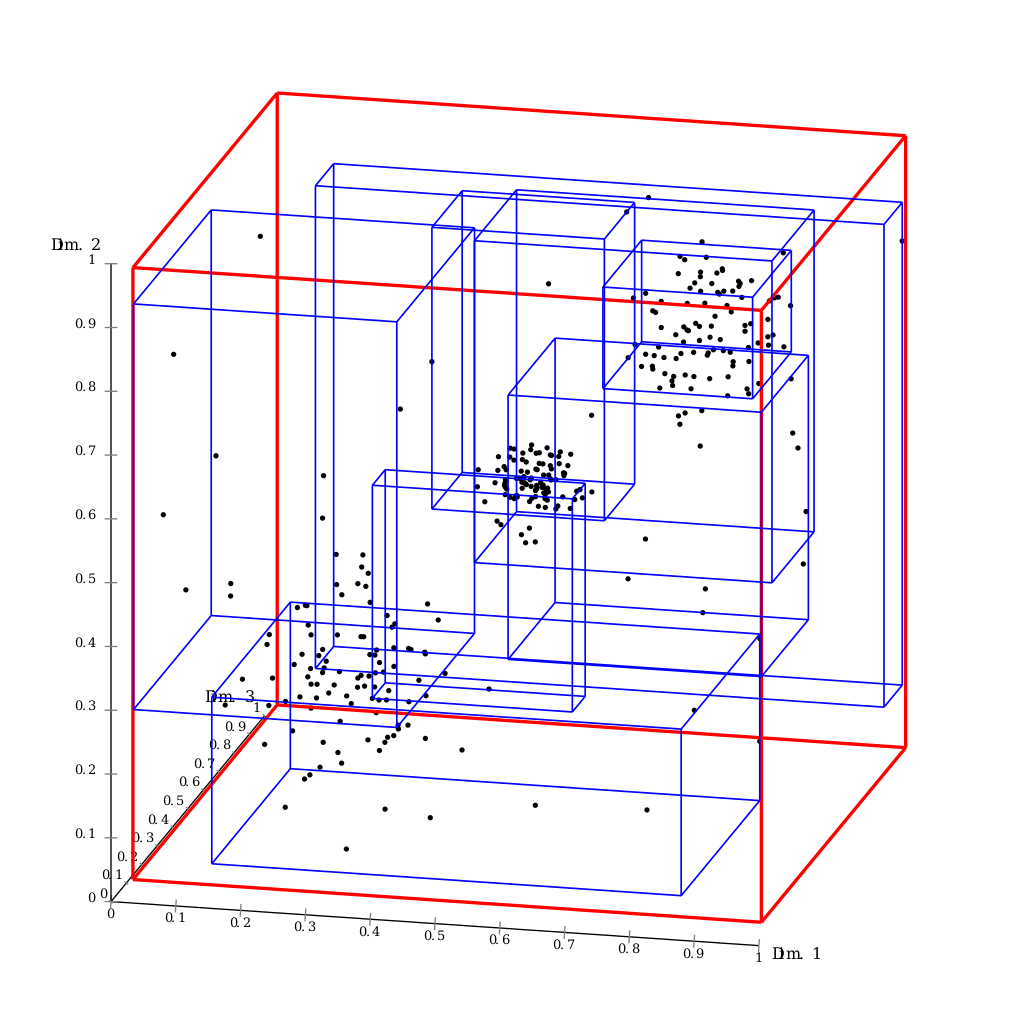
R-Trees group nearby objects and represent them with their minimum bounding rectangle (MBR) in the next higher level of the tree. The primary goal of R-Tree is to minimize the coverage of each node (minimize the area, perimeter, margin or overlap of rectangles). The rectangles in R-Trees often overlap, leading to an efficient storage and quick spatial queries, which is an advantage over other structures like QuadTrees, where there is no overlap, but more partitions leading to deeper trees.
How an R-Tree Works Explained to a Ten Year Old
Let's imagine you have a big box filled with lots of different toys - cars, dolls, action figures, legos, and so on. Now, you want to find your favorite action figure without going through the entire box. It's going to be really difficult if the toys are all mixed up, right?
So, you decide to organize your box to make it easier to find your toys. You place different types of toys into smaller boxes: one for cars, one for dolls, one for legos, and one for action figures. Each of these smaller boxes goes into the big box. Now, when you want to find your favorite action figure, you only need to look in the smaller box for action figures, not the entire big box!
An R-tree data structure works in a similar way, but instead of toys, it's used for things like locations on a map. Just like your toy box, a map can have lots and lots of data points - like cities, streets, houses, and parks. An R-tree organizes this data by grouping nearby locations together into smaller 'boxes' or regions. These regions are then put into bigger regions, and so on, until we have one big region containing all the others.
So, when a computer wants to find a location using an R-tree, it doesn't need to look at every single point on the map. Instead, it first looks at the big regions, then the smaller ones within the relevant big region, and so on, until it finds the location it's looking for. This makes searching much quicker and more efficient!
Benefits of R-Tree
Efficient Queries: One of the main benefits of using R-Trees is the efficiency of spatial queries. The R-Tree is designed to maximize data locality, meaning it minimizes the amount of disk I/O operations and makes queries faster.
Dynamic: R-Trees are dynamic, allowing insertions and deletions as data changes. This allows the R-Tree to adjust to the evolving needs of geospatial data handling.
Balanced: Like other tree data structures, R-Trees are balanced, meaning the path from the root to any leaf is the same length. This balanced nature guarantees logarithmic time search performance.
Limitations of R-Tree
Overlapping Nodes: Overlapping bounding boxes in nodes is one of the main limitations of R-Trees. It increases the likelihood of checking more branches and leads to slower query performance.
Complexity in Implementation: The algorithm to implement and maintain R-Trees is complex. Effective strategies are required for splitting nodes in order to maintain the balance of the tree and to minimize overlapping.
Difficulty Handling High-Dimensional Data: Although R-Trees can theoretically handle high-dimensional data, in practice, their performance degrades quickly as the number of dimensions increases. This is because the probability of overlap increases exponentially with the increase in dimensions.
Conclusion
Understanding the R-Tree structure is key to effectively leveraging geospatial data. Although R-Trees come with limitations such as overlap, complexity, and difficulties in high-dimensional data handling, their benefits like efficient spatial queries, dynamic nature, and balance make them an essential tool in geospatial data management. It's crucial to be aware of both the advantages and the limitations of R-Trees when choosing the right tool for your geospatial data handling needs. To broaden your understanding of spatial data management even further, check out the comprehensive guide on geospatial data structures for more insights on different data structures utilized in the field.