WebGIS Development in 2023: A Guide to the Tools and Technologies I Use for Building Advanced Geospatial Applications

Selecting the right tools for any application from the start is the most crucial technical decision that you have to make and this story is going to help you with just that.

As the world becomes increasingly digital, the use of geographic information systems (GIS) for mapping, analysis, and data visualization has become an essential tool for a wide range of industries. With the rise of the web, GIS has become more accessible than ever before, and new tools are constantly being developed to make GIS more user-friendly, powerful, and versatile.
When I started as a geospatial developer about eight years ago, the biggest question I used to have was “what are the right technologies for this particular webGIS system?” In all these years and with my progression from a freelance webGIS developer to the founder of a webGIS apps development company, I figured it out to the extent that answering this question became pretty easy.
In 2019, I wrote about the Tools I recommend for building Geospatial Web Applications and this is going to be an updated version of that because in the past 3.5 years, new technologies have emerged and I have learned new things as well so I decided to write an updated version of it that suits better for the needs of 2023 and beyond.
In this story, I will be recommending open-source tools because they offer a cost-effective and flexible solution with a large community of developers constantly working to improve and update them. And also because I love open-source tools.
Frontend
The frontend is the part that has the most importance in my opinion in a webgis project because it is what concerns all users and it has to be user-friendly. Other than the mapping part, I strongly recommend using any frontend framework to make development better, easier, and faster. My team usually uses ReactJS for this purpose due to the ease of development and the wide support it has from the development community but you can choose any framework of your liking.
The geospatial frontend can be further divided into two categories:
Two Dimensional visualization
For two-dimensional visualization, I recommend Leaflet and OpenLayers. My rule is simple: If it is a simple application, use Leaflet for its simplicity and ease of use. If it requires slightly complex use cases like displaying multiple layers in different projection systems, then go for OpenLayers.
I once had to change my strategy and redevelop a map in Openlayers that I had already developed in Leaflet because we had to add layers in different coordinate systems.
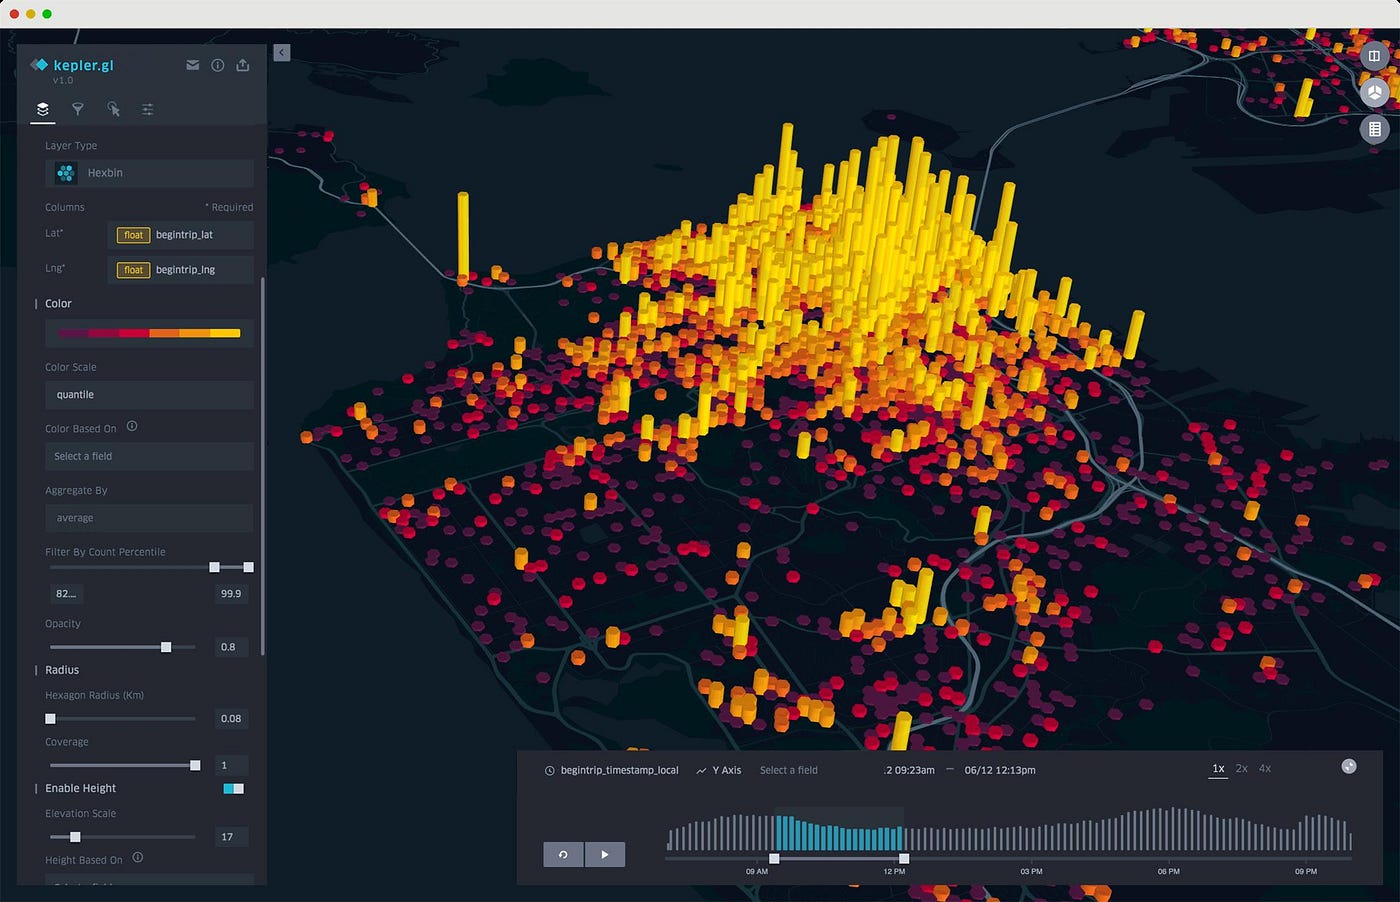
In two-dimensional visualization, one tool I didn’t talk about in the last story is Kepler.gl. Kepler.gl is an open-source data visualization tool that allows users to create interactive maps, geospatial data visualizations, and analyses. It is built on top of the web-based platform, WebGL, and is built with the power of deck.gl and react-map-gl, which provide efficient and smooth rendering capabilities.
This tool, open-sourced by Uber, in my opinion, is currently the best tool for creating data-driven maps. It is also better at handling slightly larger amounts of vector data (as compared to OpenLayers and Leaflet)
Three Dimensional Visualization
This is the part I didn’t talk about in the last story because frankly speaking, I didn’t have much experience working with 3d data at that time. But then I had to look into it for some applications and for that, the library that I found most useful is Cesium.
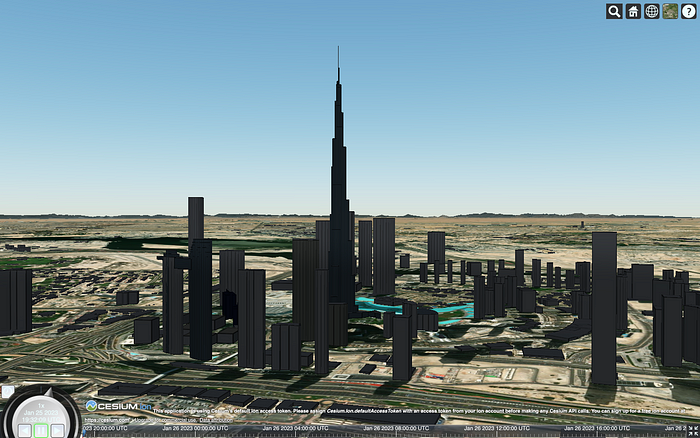
It is an open-source javascript library that lets you add 3d terrain and 3d data in your mapping applications and is very powerful in its capabilities. At this moment, it does not have any open-source competitor and I have used it in multiple applications since I first got introduced to it.

Turf.js
Turf.js is an open-source JavaScript library for performing spatial analysis on geospatial data. It is designed to work with geospatial data in GeoJSON format. The library provides a wide range of spatial analysis functions, such as buffering, merging, and intersection of geospatial data, as well as advanced spatial analysis functions such as spatial interpolation, clustering, and data classification.
Since it is written in javascript so it can be used not just in the frontend but backend as well if you build the backend in javascript.
Backend
In web GIS applications, the backend refers to the server-side components that handle tasks such as data storage, processing, and management. These tasks are necessary to support the frontend, which is the user interface that users interact with. The backend is responsible for handling requests from the frontend, such as querying the database, performing spatial analysis, and generating maps. It also provides APIs that the frontend can use to access and manipulate the data.
For the backend, the following are the technologies that I usually use:
Django/Geodjango
GeoDjango is a web framework built on top of the popular Django framework, specifically designed for building GIS web applications. It provides a set of tools and libraries for handling geographic data and performing spatial operations, such as querying, analysis, and display of data on maps.
The best part about Geodjango is that it is built using Python in which a lot of good geospatial libraries (like GDAL and Rasterio, which I will be talking about later on) are made and that can be easily integrated into applications using Geodjango.

I first started using it in 2015 as a student building small geospatial projects and have loved it ever since.
GDAL
GDAL (Geospatial Data Abstraction Library) is a powerful open-source library for working with geospatial data in a variety of formats. It provides a comprehensive set of tools for reading, writing, and manipulating geospatial data, including raster, vector, and elevation data. GDAL is widely used in many GIS and geospatial contexts, such as remote sensing, digital mapping, and spatial analysis.
GDAL is written in C++, but it also provides a number of wrappers and bindings for other programming languages, including Python, Java, and C#, making it easy to use in a variety of contexts. It is the Python wrapper that I usually use because it integrates seamlessly with Geodjango.

Rasterio
Rasterio is an open-source library for reading and writing raster data in Python. It is built on top of GDAL. Rasterio provides a powerful yet simple and easy-to-use interface for reading and writing raster data in Python, designed for use in GIS or geospatial contexts.
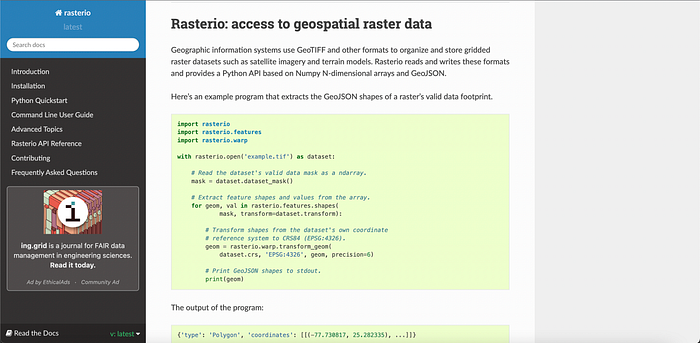
Again, because of being written in Python, it can be very easily integrated with a geodjango (or other python) based backend.
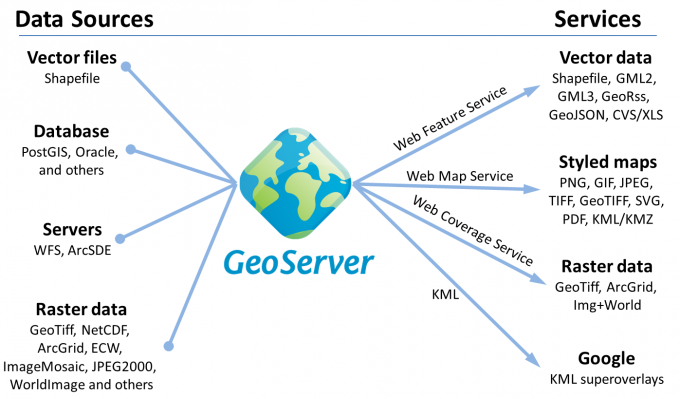
Geoserver
GeoServer is an open-source server software that allows users to share and edit geospatial data. It is written in Java and is built on top of the OGC (Open Geospatial Consortium) standards for geospatial data sharing, such as WMS (Web Map Service), WFS (Web Feature Service), and WCS (Web Coverage Service). It is commonly used to publish geospatial data as web services. These web services can then be used to integrate data in frontend mapping libraries I discussed above.
Database/Postgis
GIS is all about data and data is its core. So in my opinion, the most critical part of any geospatial application is the database. There are multiple databases that exist for storing geospatial data but my choice in most cases is PostGIS.
PostGIS is an extension of the PostgreSQL database management system that adds support for geographic data and spatial operations. It allows users to store, query, and manipulate spatial data, such as points, lines, and polygons, in a PostgreSQL database. It also includes a variety of spatial analysis and data management tools, such as support for geometric functions and spatial indexes. It is the most mature open-source geospatial database out there and is the most capable one as well.
Miscalenous
In this section, I will be talking about tools and technologies that I can’t specify as frontend, backend, or database but still find very useful.
Geonode
GeoNode is an open-source platform for building and deploying web-based Geospatial data stores. It is also built on top of the GeoDjango framework and Geoserver that I discussed above. On the database side, it uses PostGIS. It is a complete package that combines backend, frontend, database, and all other components.
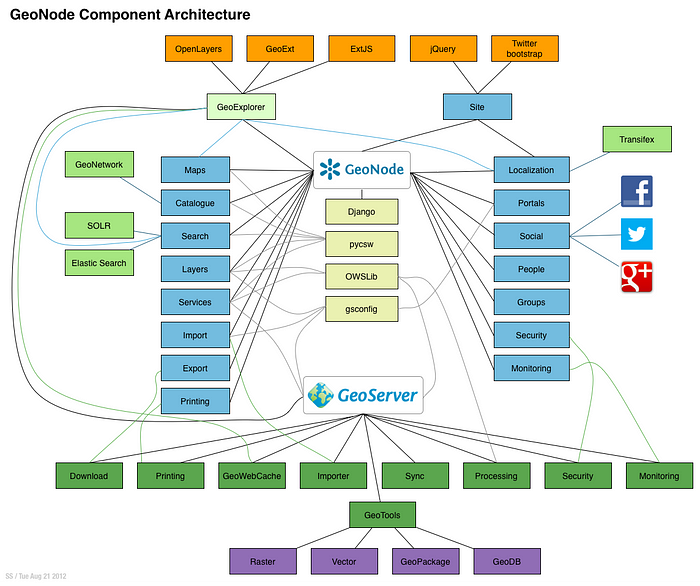
GeoNode provides a wide range of features for building web GIS applications, including data management, mapping, and spatial analysis. It has a user-friendly interface for managing and publishing spatial data, which allows users to easily upload and share their data with others. It also provides a web-based map viewer that allows users to view and interact with maps, as well as a set of tools for performing spatial analysis.
One of the key features of GeoNode is its support for OGC (Open Geospatial Consortium) standards, which allows it to interoperate with other GIS software and services. It supports a variety of data formats, including shapefiles, KML, and GeoJSON, and can be integrated with other GIS software such as QGIS, ArcGIS, and GRASS.
GeoNode is also highly customizable and extensible if you have knowledge about its code. It is a complete package if you want to deploy a geospatial data store and helps a lot as you don’t have to start from scratch.
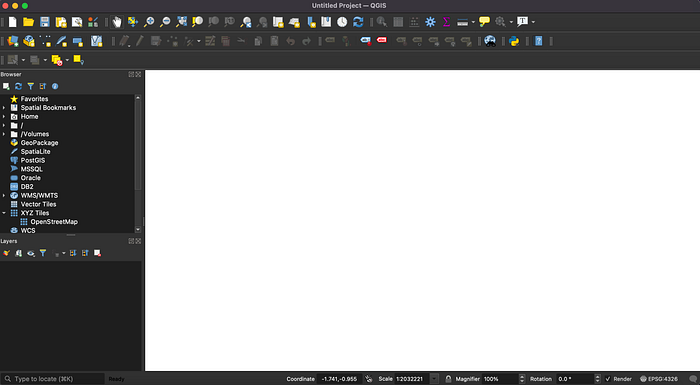
QGIS
For most of the applications, geospatial data has to be first processed and preprocessed and for that matter, my choice in most cases is QGIS.
QGIS (short for Quantum GIS) is a free and open-source desktop GIS application. It allows users to view, edit, and analyze spatial data. QGIS supports a wide variety of vector, raster, and database formats, including shapefiles, GeoTIFFs, and PostGIS databases. It also includes a variety of tools for data analysis, such as spatial queries, overlays, and geoprocessing.
QGIS is similar in functionality to commercial GIS software, such as ArcGIS, but is available at no cost and can be easily customized and extended through the use of plugins.
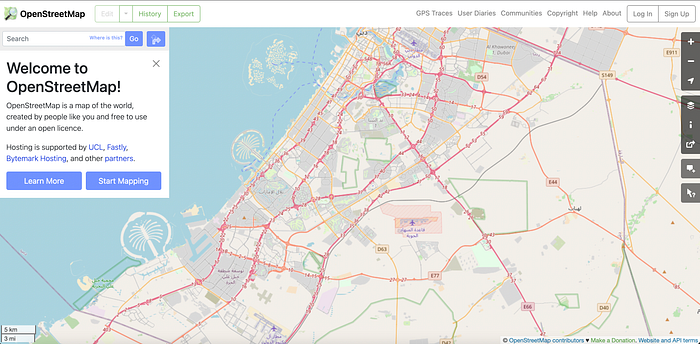
OpenStreetMap
OpenStreetMap (OSM) is a free and open-source project that creates and provides a global map of the world. It is a collaborative project that relies on community contributions to create and maintain a detailed map of the world. Users can use the map data for any purpose, including creating maps and location-based services, without the need for permission or fees.
OSM was started in 2004 and is now the largest collaborative mapping project in the world, with over six million registered users and more than four billion data elements. The data is collected using a variety of methods, including GPS tracks, aerial imagery, and user-contributed data. The data is then stored in a database and made available through a variety of APIs and data downloads.
I mainly use it for two purposes in my applications:
- As a basemap (worldmap under the data) in my applications
- As a data source because its data is free and open-source and can be downloaded by anyone
OSM has many advantages over other map providers, such as its free and open-source nature, frequent updates, and the ability to customize maps. However, the quality of the data may vary depending on the location and level of contributions, and some areas may have less coverage or detail than others.
Diva-GIS
DIVA-GIS is a free and open-source GIS software that is primarily used for analyzing and visualizing biodiversity-related data but I mainly use it as a data source because it has datasets like administrative boundaries, rivers, etc. Head on to their free spatial data to see what is available.

Just like the last time, I’d like to conclude by saying that there is no fixed answer and that the right combination of tools and technologies that you need to use depends entirely on the use case of your application. The only rule to stick to is that the simplest solution is the best solution so don’t pick too many tools that you might not even need for your application. If you want more help with selecting the right tools for your application, feel free to get connected or write to me.
I am Ramiz Sami. I climb mountains, lift heavy weights and build WebGIS solutions. Feel free to get connected with me on Linkedin.
Article originally posted on Here.