How to Geocode Data in R

Geocoding is the process of converting addresses into geographic coordinates (latitude and longitude) that can be plotted on a map. In this tutorial, we’ll explore how to geocode data using R and visualize the results using the leaflet package.
Step 1: Loading the Required Libraries
The tidyverse is a collection of R packages designed to make data manipulation and analysis easier and more efficient. It promotes a consistent and tidy data format and provides a set of tools that work seamlessly together.
dplyr is a core package within the tidyverse that provides a set of functions for data manipulation and transformation. It introduces a grammar of data manipulation, allowing you to express complex data operations in a concise and readable manner.
tidygeocoder is an R package that provides geocoding functionality, allowing you to convert addresses into geographic coordinates (latitude and longitude). It leverages various geocoding services and APIs to retrieve the geolocation information.
Finally, leaflet is an R package that provides an interactive and flexible mapping environment. It allows you to create interactive maps with various layers, markers, pop-ups, and other visual elements, making it an excellent tool for data visualization and exploration.
library(tidyverse)
library(dplyr, warn.conflicts = FALSE)
library(tidygeocoder)
library(leaflet)
Step 2: Reading the Data
Assuming you have a CSV file named “test.csv” containing address information, you can read the data using the read_csv function from the tidyverse package:
data <- read_csv(“test.csv”)Step 3: Geocoding the Data
To geocode the addresses, we’ll use the geocode function from the tidygeocoder package. This function takes the address field as input and returns the latitude and longitude values.
addr <- as.data.frame(data)

lat_longs <- addr %>%
 geocode(author_location, method = ‘osm’, lat = latitude, long = longitude, full_results = TRUE)
Here, author_location should be replaced with the name of the address column in your data, and latitude and longitude should be the names of the new columns where you want to store the geocoded coordinates.
Step 4: Cleaning the Data
It’s common to encounter null or missing values during the geocoding process. To remove these null values from the geocoded data, we can subset the dataframe using the subset function.
new_DF <- subset(lat_longs, lat_longs$latitude != “”)Step 5: Saving the Geocoded Data
To save the geocoded data as a new CSV file, you can use the `write.csv` function.
write.csv(new_DF, file = “new_DF.csv”)Step 6: Visualizing the Geocoded Data
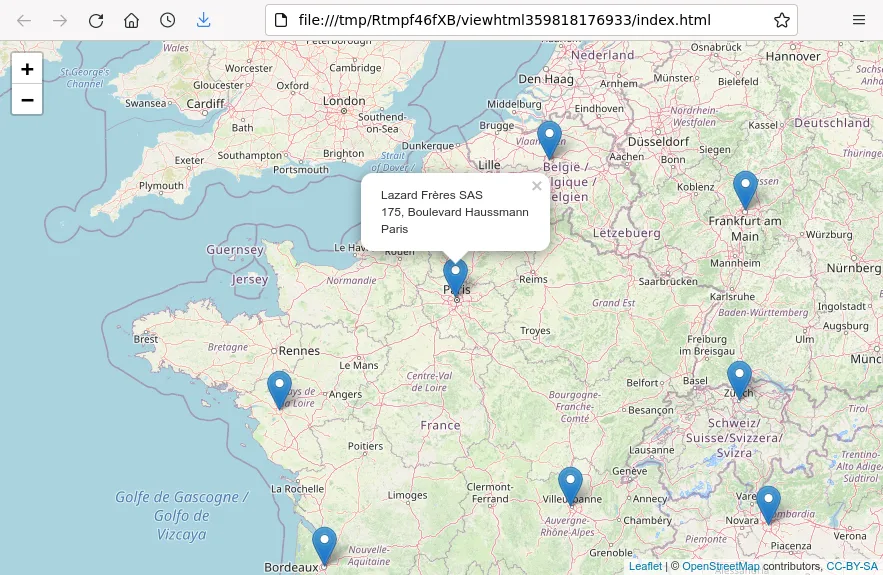
To visualize the geocoded data on a map, we’ll utilize the leaflet package. The leaflet package provides an interactive mapping environment.
m <- leaflet(new_DF) %>%
 addTiles() %>%
 addCircleMarkers(lng = new_DF$longitude, lat = new_DF$latitude, clusterOptions = markerClusterOptions())

m # Print the map
The code above creates a map using the geocoded data and adds circle markers for each location. You can customize the map appearance and markers according to your preference.