Open Source Geospatial Data Acquisition for Ecuador

Navigating the world of geospatial data can be a breeze if you're equipped with the right knowledge and tools. In this updated guide, we'll embark on a journey to discover and catalog open source geospatial data specifically for Ecuador. We'll delve into a variety of resources, from the timeless utility of Google Earth Pro to the comprehensive data layers of WPF GeoNode. We'll explore the Global Land Analysis & Discovery (GLAD) laboratory's insights on land surface change, the forest data from Globalforestwatch.org, and the diverse datasets available on the Humanitarian Data Exchange (HDX). This article, originally penned for a now-defunct startup, has been refreshed to reflect the latest advancements and trends in the field. Let's dive in.
Google Earth Pro: A Timeless Tool
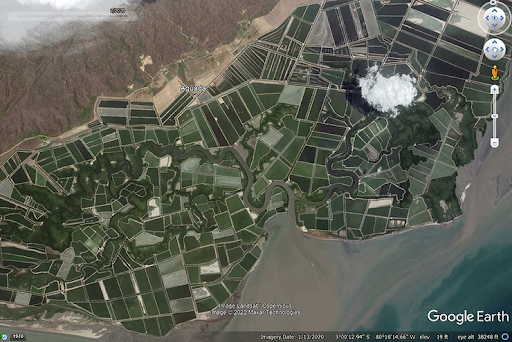
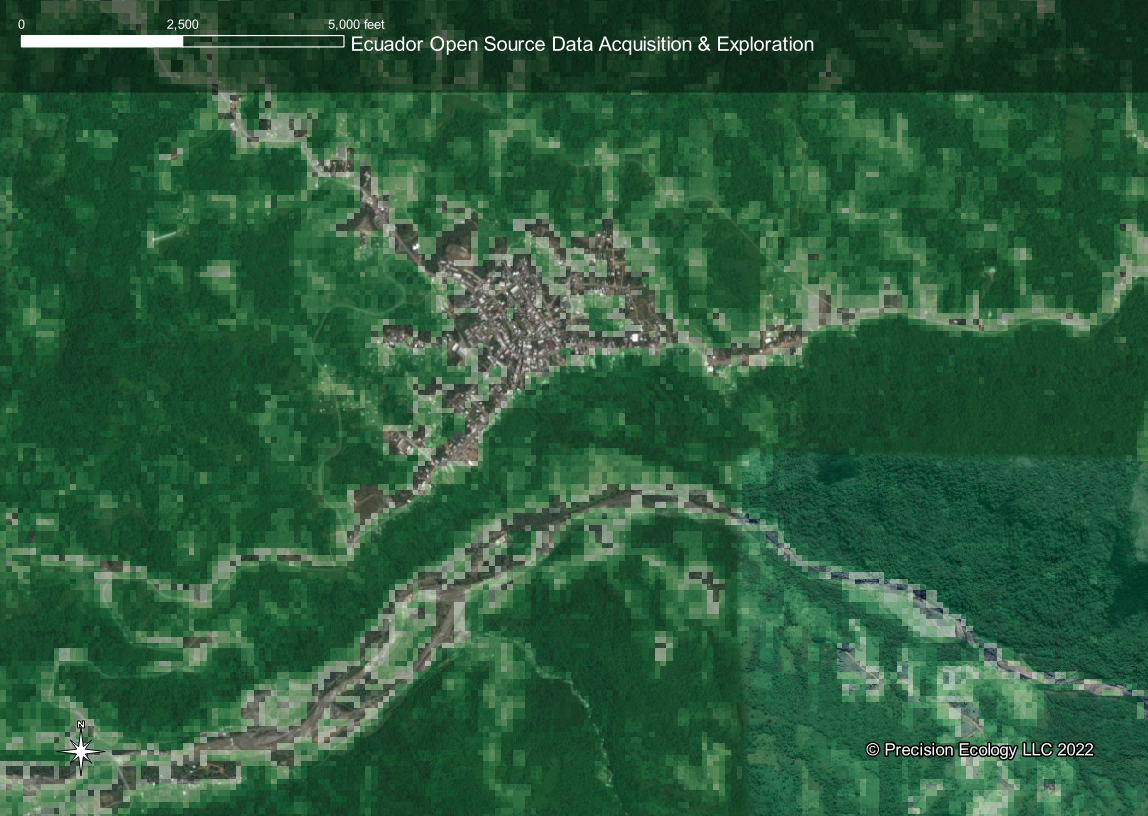
Google Earth Pro, the desktop version not the web version, is the perfect tool to begin any open source geospatial data collection project. Depending on the location there is plenty of historical imagery to start creating points and areas of interest. The application allows basic functions like marking points, creating paths, polygons and measurements. The following imagery examples highlight the date range and quality of images over the same coastal area of Aguada in Ecuador.
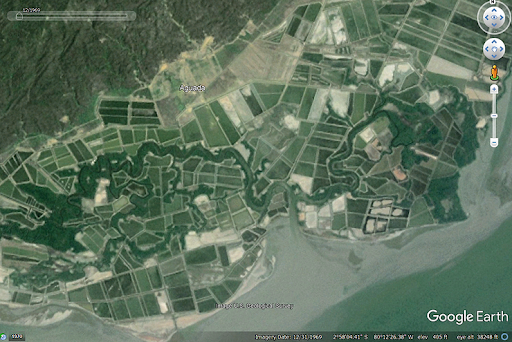
The frequency and quality of imagery over areas varies a lot and most of the time depends on how populated the area is and how much economic power the area has. In the image below even though the image has finer details and is more recent there is a small percentage of the image that contains cloud cover which is not present in the imagery from 1969. The right and best image may not be the most recent, so it is worth zooming in and scrolling through the historical imagery for your areas of interest.
Savgis.org: A Go-To Source for DEMs
This next source is the first search result when you Google "ecuador gis data". Savgis.org contains Digital Elevation Maps (DEMs) in varying resolutions from 450m per pixel all the way down to 30m per pixel. These scales may be too large for looking at small areas but are perfect for doing terrain analysis across the entire country.

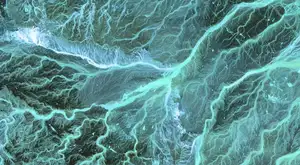
We can quickly use one of the QGIS built in tools for slope analysis to generate a slope map using the DEM as an input. Below you will see the resultant slope map visualized with a white to black gradient.

The slope raster helps us identify the steepness at each point. It makes it easier to identify rivers and valleys and mountain. The DEM is useful but sometimes difficult to find details with specific visualizations. When we combine these two layers together by applying some transparency the result becomes a very useful terrain map.

Keep in mind that this data is not the best resolution available from the savgis.org source. We used the 450m per pixel DEMs. Using any of the finer resolution DEMs would increase the resolution of the maps we created here substantially. Using the coarse resolutions we are able to quickly generate maps and analyze large areas in a matter of minutes.

GLAD: A Hub for Global Land Analysis & Discovery
The Global Land Analysis & Discovery (GLAD) laboratory is a part of the Geographical Sciences Department at the University of Maryland. The lab is focusing on researching methods, causes and impacts of global land surface change. The data set we will be examining today from GLAD is the Global Forest Change 2000–2021 data set. The lab has many more data sets available here.
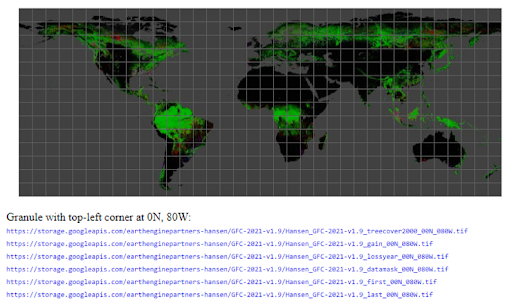
Utilizing the download tool for the data set we can click the box we want and select the layer we want to download. For this example we will be using the tree canopy cover for year 2000 data. After downloading four of the .tif files, stitching them together and then applying style changes to make the zero values not show up we are left with a large data set over our country of interest Ecuador.

Zooming in we can get a better idea of the resolution of the data set. It becomes quite apparent where the urban areas and bodies of water are located.
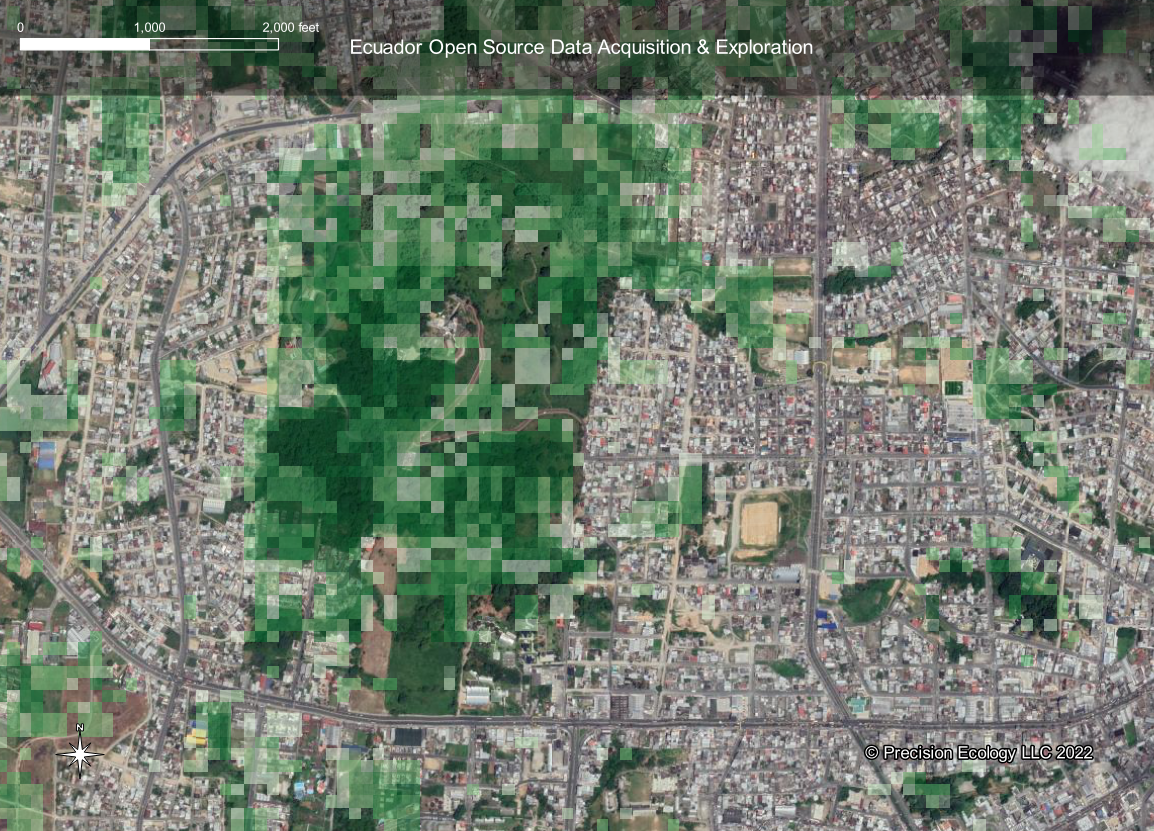
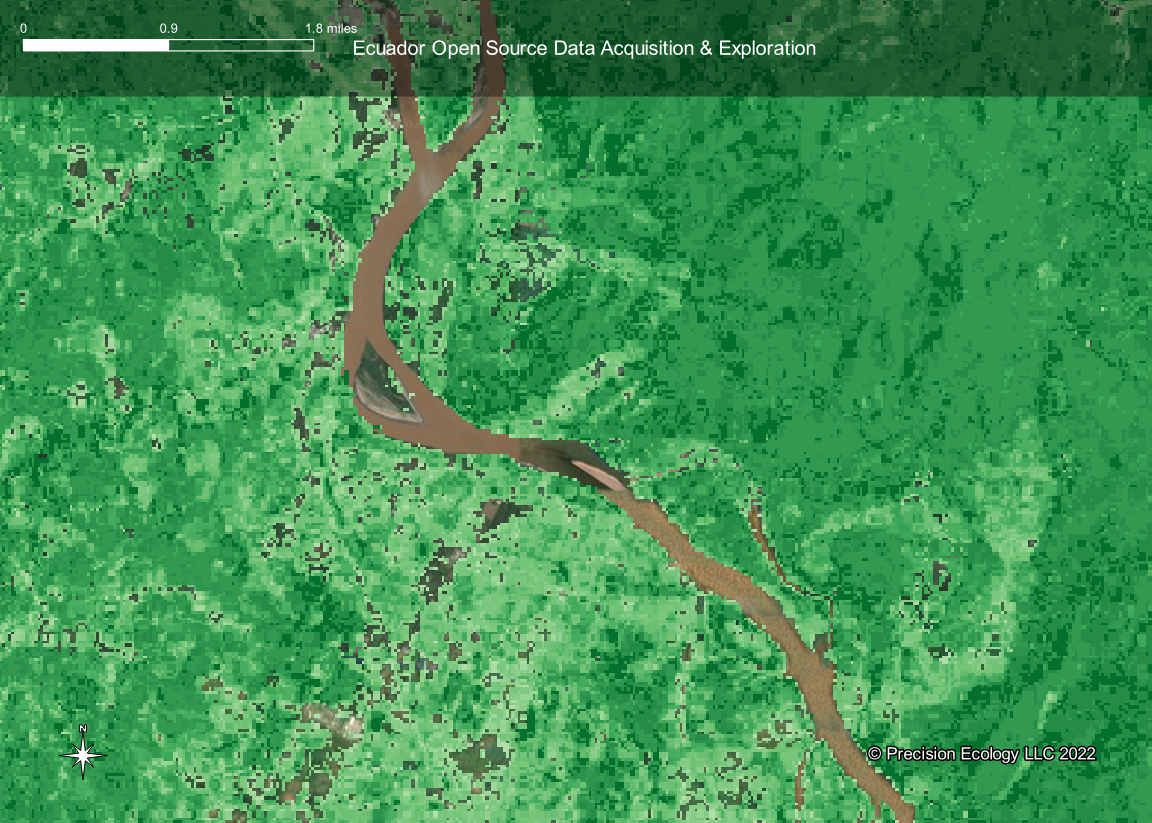
We can change the gradient color from green to red to better visualize the data against the green agriculture fields present in the satellite base imagery. This type of data allows us to easily identify land cover and the other available layer from GLAD regarding gain and loss when incorporated into our maps can give us even deeper insights into how the environment in our area of interest is changing.

WPF GeoNode: A Treasure Trove of Layers
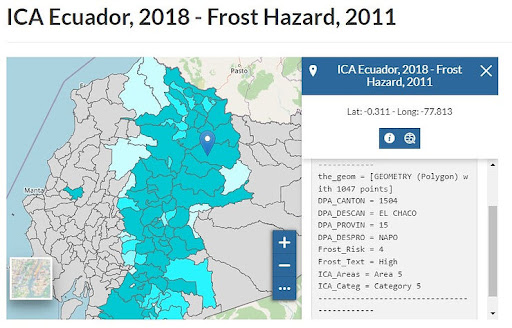
WPF GeoNode has a data portal with over 600 different layers available. When enter a query for our country of interest Ecuador, we receive 11 different layer options. These options include administrative boundaries, frost hazards, erosion propensity, recurrence of food insecurity, natural shock hazard, drought hazard, and flood hazard to name a few. These layers and their metadata details are available for viewing and downloading on the WPF GeoNode website.
We will be adding the road layer to the map we have been creating thus far. The road data can be filters by type to create different colors or sizes for road types. We will stick with a single color but make the major highways larger than secondary and tertiary roads.

The areas of urban development begin to show up very easily with the major road layers added to our map. Adding municipal boundaries and land use classifications would make this map even more informative.
Globalforestwatch.org: A Comprehensive Platform for Forest Data
Similarly to GLAD, global forest watch provides and easy to use platform for understanding forest cover change. The platform allows for administrative area selections where the data is explained and visualized. This is all done on their web GIS platform, and the data is available for download.
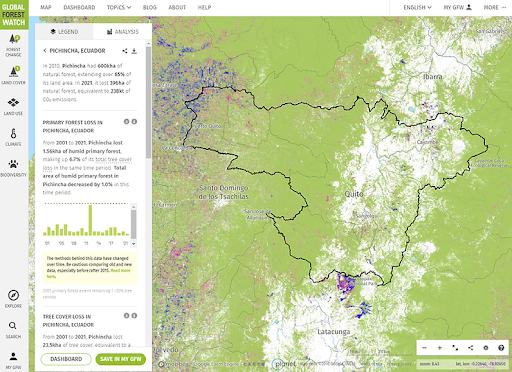
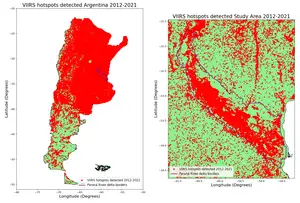
Besides forest data, the platform also contains other sources such as fire alerts (VIIRS), tree biomass density, global carbon removals and many many more. The platform act almost as an index for forest related data and is and excellent source for such data.
Humanitarian Data Exchange: A Wealth of Datasets
HDX currently has 206 datasets for Ecuador ranging from food prices to conflicts and everything in between. We will quickly download the health site data set and add it to our map.
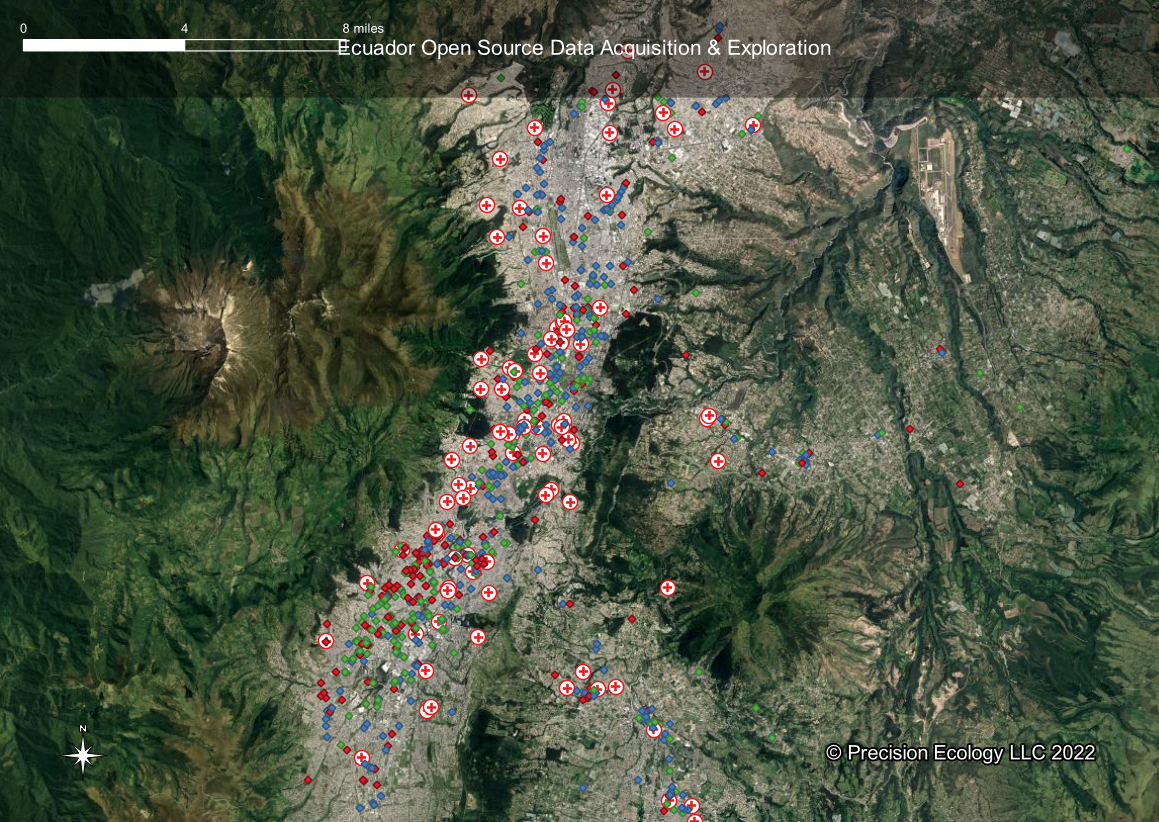
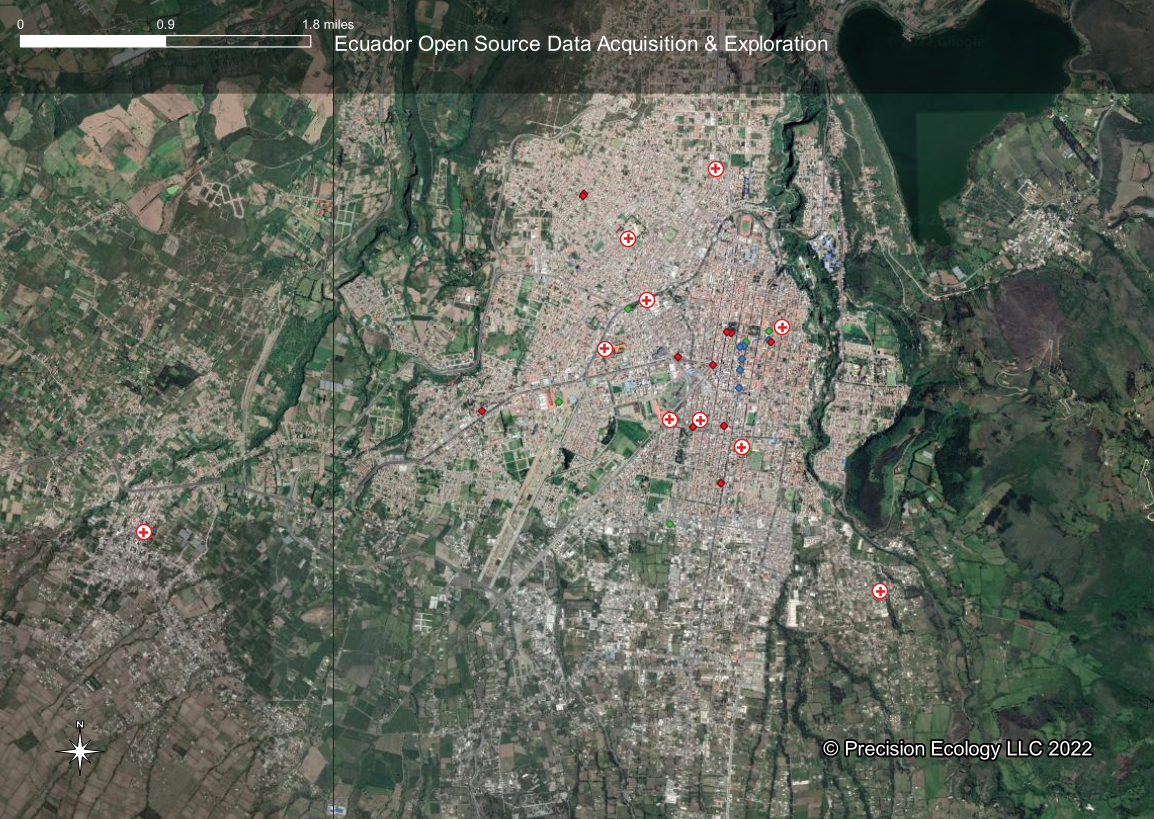
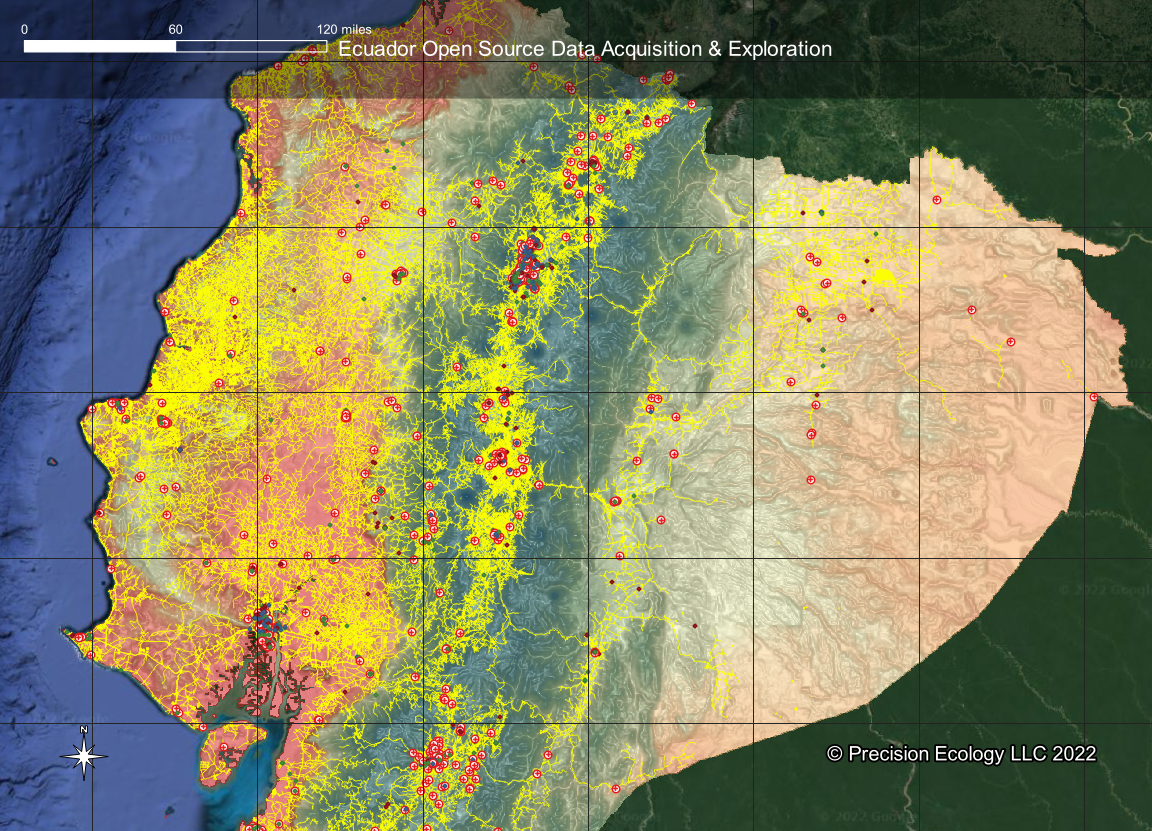
After adding the data to our QGIS project we can add some style changes based on "amenity" types to display different symbols for different types of health sites like hospitals, doctors, clinics, and pharmacies.
Wrapping Up: Harnessing Open Source Geospatial Data for Ecuador
In conclusion, the world of open source geospatial data is vast and ever-evolving. From leveraging the comprehensive capabilities of Google Earth Pro to exploring the extensive data layers of WPF GeoNode, we've navigated various resources to gather and analyze geospatial data for Ecuador. We've also delved into the insights provided by the Global Land Analysis & Discovery (GLAD) laboratory and Globalforestwatch.org, and explored the diverse datasets available on the Humanitarian Data Exchange (HDX). As we continue to stay abreast of advancements in this field, our ability to understand and interact with our world through geospatial data only grows stronger.