What is a Geographic Information System?


How GIS components work together. A transformation based view of GIS operation, in Martin. D. (1995). Theories of GIS. Wikimedia Commons CC Image
What is a GIS?
GIS stands for Geographic Information System. A GIS holds different types of geospatial data types like rasters, points, lines and polygons for visualization and analysis. The technology of visualizing and analyzing geographic data can be applied to any industry and add value.
What is GIS used for?
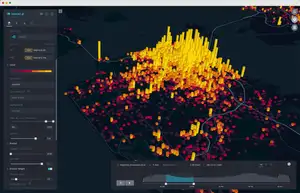
GIS can be used to identify problems, monitor changes, manage and respond to events, perform forecasting, set priorities and to understand trends. GIS is used in many different industries including but not limited to environmental, emergency, urban planning, real estate, government, military, agriculture and many more.

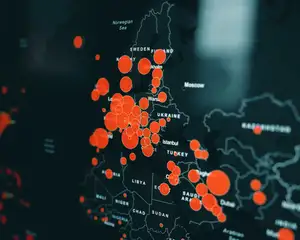
The original map drawn by Dr. John Snow (1813-1858), a British physician who is one of the founders of medical epidemiology, showing cases of cholera in the London epidemics of 1854, clustered around the locations of water pumps. Wikimedia Commons Public Domain Image
Examples of GIS uses in different industries
Real estate agents use a GIS to visualize average home prices across different areas. Urban planners and developers use GIS to outline zones where certain types of buildings and amenities will be placed in cities and neighborhoods. The military uses GIS to plan missions and monitor situations like movements of troops and equipment.
What data can be used in a GIS?
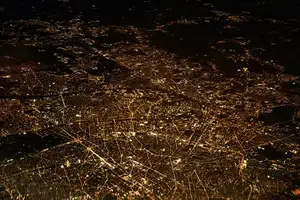
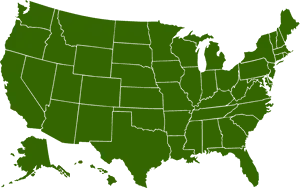
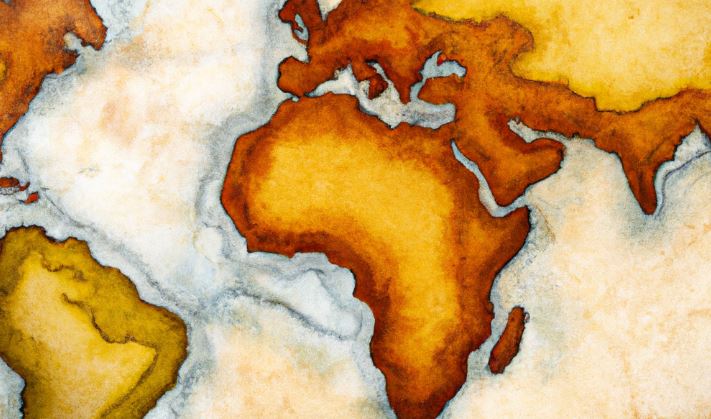
A GIS requires spatial data, or data that is tied to a specific location on Earth. Satellite data is often the first type of data that comes to mind when thinking about GIS. Using satellite data users are able to see what the world looks like the time the images where captured and how it may have changed if there were previous images taken. Polygon data is often used to show country, state, city and municipal boundaries. A line might be used to show a road or a river. A single point or a collection of points might be used to show where events happened or where something is located.